The map below illustrates the inequality in Rio de Janeiro and the pacification and development of Rio’s favelas in an effort to curb violence and ‘clean up’ the city before the World Cup and Olympics. The changes that have been taking place have been in progress since the first favela pacification happened on December 19, 2008 up until today and not only have environmental impacts, but also social. These changes were initiated after October 30, 2007, which is when the 2014 World Cup was awarded to Brazil.
Key
- The green pin indicates where I’ve lived
- The red pin is the first favela that underwent pacification
- Yellow pins indicate where I’ve visited
- Blue pins indicate where I’ve yet to visit
- $ Dollar signs $ indicate places of interest for tourists
- Turquoise areas: regions of the city that are designated sporting areas for the World Cup and/or Olympics
- Orange areas: The two most affluent areas in Rio de Janeiro
This map is is drawn off of my experience of living in Rio’s largest favela, Rocinha, where I became heavily invested in the community and saw first-hand how the developments were impacting the communities and residents that were pacified by the government. While there are benefits to the pacification, it has also been problematic in that these places still remain heavily underserved, with promises for social programs not being delivered. Another issue is that members of these communities have largely had little input into the development of their communities, which has resulted in wasteful spending, for things like cable car systems, that have come before more important investments into education and health care. Some of these areas have also experienced forced evictions for projects or are currently experiencing gentrification, with the most extreme example being the favela of Vidigal – where construction for a five star hotel is currently underway and many long-term residents have left the favela to neighborhoods further into the outskirts of the city because of the rising cost of living. The themes that this map aligns with most are inequality and development, with some areas and pins highlighting the stark contrasts in social/socioeconomic classes. For example, two areas shaded in are the wealthiest areas in the whole city, but have low-income communities wedged between or stacked next to them. There is a very small middle class in Brazil and it’s quite common to be walking through a neighborhood of millionaires and then unintentionally end up in a favela. While I did not include every single pacified favela, I did pin most of them and it can be noticed that almost all are near tourist areas and World Cup/Olympic zones.
“Venues Map.” Rio2016. Rio1016, n.d. Web. 8 Nov. 2015.
“As Upps.” Unidade de Polícia Pacificadora RJ. Governo do Rio de Janeiro, n.d.Web. 7 Nov. 2015.
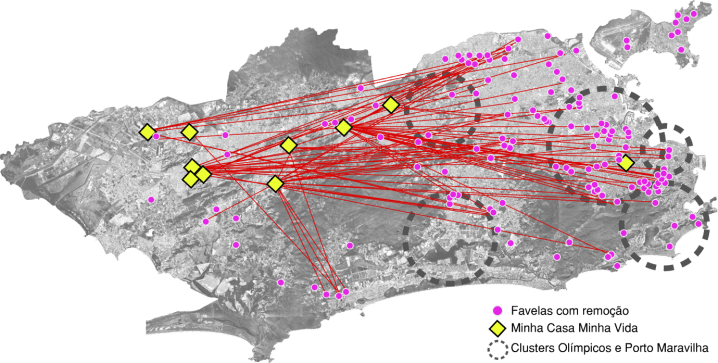
In preparation for the World Cup and the Olympics, the government of Rio implemented a program called “Minha Casa Minha Vida” or “My House My Life” that aims to relocate favela residents to new housing communities. In many favelas, residents are forcefully evicted with little to no say and little awareness of their rights to organize and mobilize.
- Yellow marks represent each newly constructed housing community of the Minha Casa Minha Vida program
- Magenta represents the favelas that are or were subject to removals, either voluntary or forcefully
- Circles represent the four Olympic zones and a major urban developmental project called Porto Maravilha
 Jennifer Kim